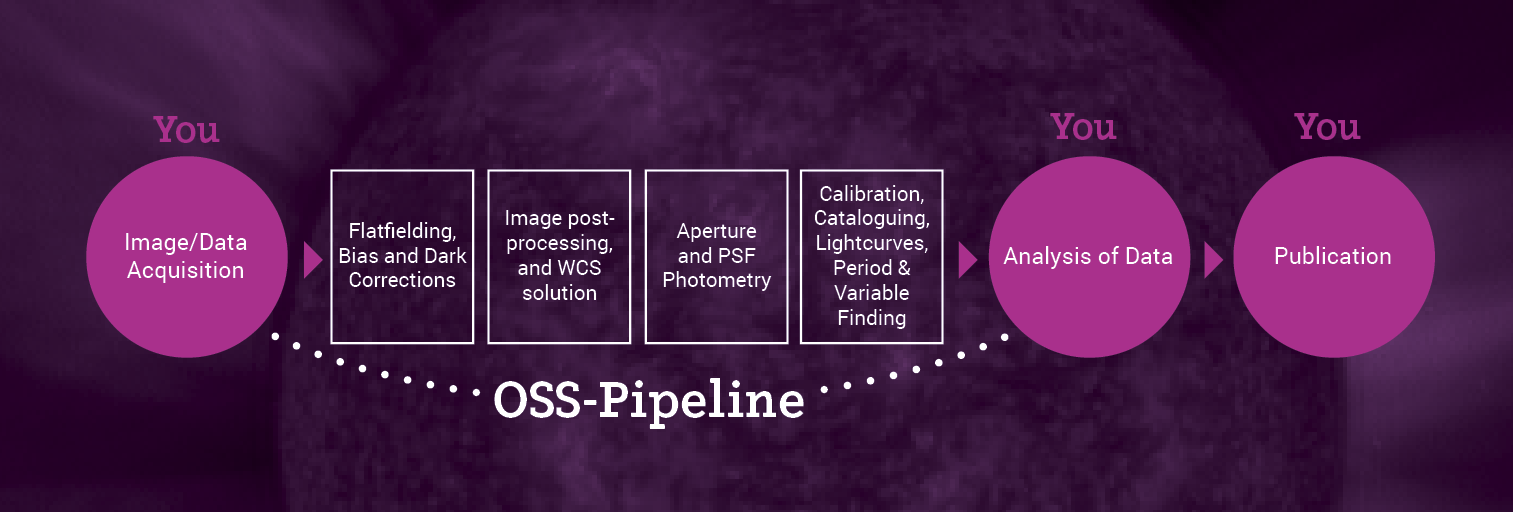
The OSS Pipeline provides high quality, science grade data products from an automated image processing, photometry and distribution pipeline. It is provided for free to high school teachers and students involved in the Our Solar Siblings project as well as LCO Education Partners and as a charged service to all others. The charged service provides the resources to provide the pipeline for education users who do not have substantial budgets to spend on their students. The goal of OSS-Pipeline is to get users from the menial data ‘reduction’ to the inquisitive data ‘analysis’ and interpretation with the least amount of human hours and effort used. While the reduction process from image to actual data can be a fascinating process, it is largely automatible in the modern era. If pro-am and student research is to compliment the (already robustly and homogenously automated) datastreams from modern telescopes such as Kepler, TESS, LSST, SDSS and Pan-STARRS, then it too must also be automated in a robust and homogenous manner.
Features
- If provided a set of flats, biasses and darks, the pipeline will automatically correct the images
- Standardises, fixes and ‘fills-in-the-blanks’ of fits headers
- Renames and standardises filenames to contain useful information
- Calculates the observation time in JD, MJD, HJD and BJD
- Automatically applies a new WCS solution as well as fixes broken, or inaccurate WCS solutions
- Requiring no information on pointing, it finds the RA, Dec and Airmass of ‘lost’ images given a time and location.
- Removes known bad columns and bad pixels
- Detects and removes hot and cold pixels Automatically removes cosmic rays
- Creates preview pngs of each image (other formats upon request)
- Automatically stacks images of the same field of view
- Automatically creates a colour image upon detecting B, V and R images
- Six different photometric methods are undertaken on each image, 3 PSF-based and 3 aperture or aperture-like methods.
- A photometric catalogue is provided for each image containing measurements of each detected star in the image.
- Creates files that are compatible with most available software packages
- Photometric outputs can be automatically calibrated against images in the field. This is available for u,g,r,i,z sdss filters as well as B and V Bessell filters. Wide-band filters such as lum or white filters can be pseudo-calibrated to an appropriate filter, usually V.
- A full catalogue of BV or ugriz magnitudes are provided crossmatched to multiple catalogues (e.g. 2MASS, WISE, GAIA, APASS etc.)
- The image and photometry files can also be directly opened in Aladin to explore the VO opportunities available there as well as in TOPCAT for crossmatching with major astronomical databases.
- Given specific observations, automatically create a fully calibrated photometric catalogue crossmatched to 2MASS, WISE and GAIA to permit multiwavelength observations of open and globular clusters
From this stage, the results pipeline can be further custom automated in a number of directions upon request. For instance, it can be set to automatically extract an exoplanet lightcurve or to detect variables in a set of images. With sufficient primary or secondary standards or comparison stars, this can be set to output calibrated variable lightcurves to be brought into your period or lightcurve analysis software of choice. If you are catering to many users, the files can be set to be automatically distributed via various means to your users. Automated asteroid trail removal and automated blooming removal is in process of being trialled. More photometry methods will also be added over time.
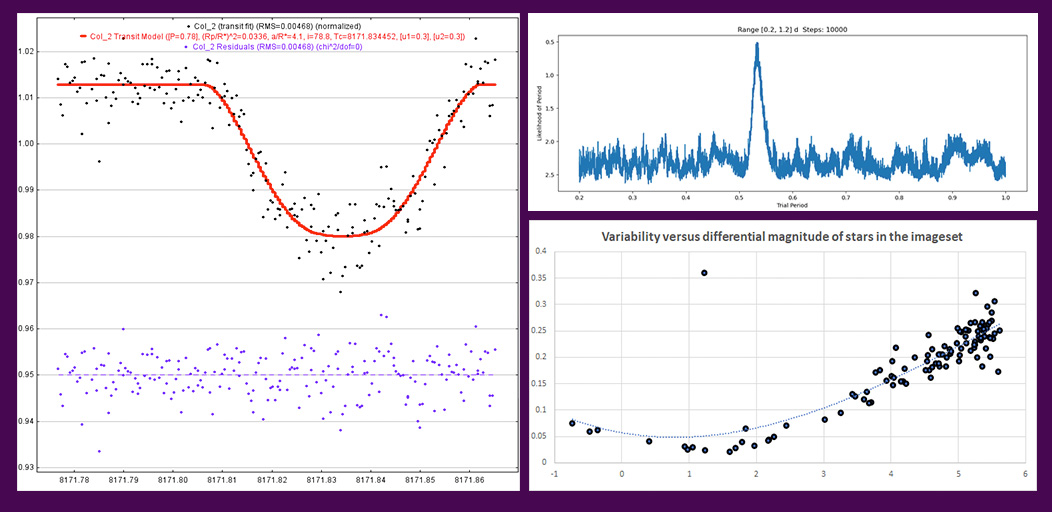
Above: (Left) Exoplanet transit extracted from pipeline data and fit in AstroImageJ (Top-Right) Period searching using Phase Dispersion Minimization. (Bottom-Right) Star Variability search function – An RR Lyrae variable standing out from other stars
A monthly subscription includes setting up an automated process to collect and process the images from your observatory. This setup will be different for each user, but will likely involve acquisition through ftp, Dropbox or a Google Drive account. One-off or irregular processing can be manually uploaded directly through dropbox.
The standard pipeline provides flatfielded and bias/dark-corrected frames that are processed as outlined in the features above. Each image also has a provided photometric catalogue using six methods, two SExtractor-based aperture-like methods, Aperture Photometry Tool aperture corrected optimal aperture photometry, PSFEx PSF Photometry, DAOPhot and DoPhot PSF Photometry. The PSF photometry works wonderfully in crowded fields near the galactic plane or within globular clusters. Preview images as well as automatic stacks and colour images are provided. We can provide some simple python scripts that can run on these files to extract variable stars from the data, including exoplanet transits, with optimal calibrated ensemble photometry or we can set up the pipeline to further automate this extraction for you. The image and photometry files can also be opened in Aladin to explore the VO opportunities available there as well as in TOPCAT for crossmatching with major astronomical databases.
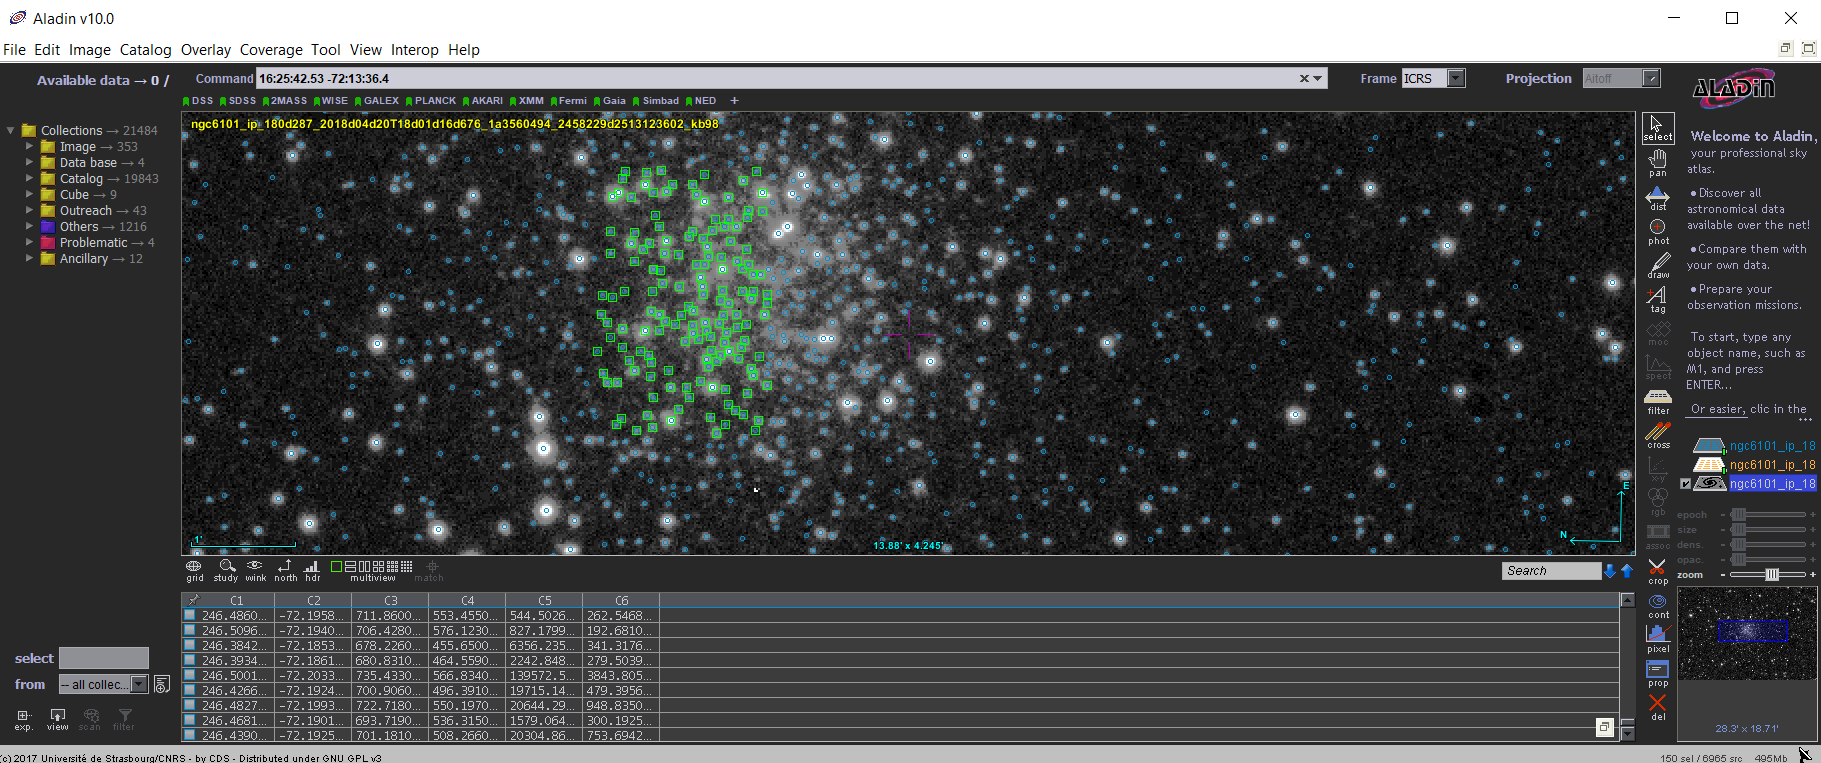
Above: Image of a globular cluster opened in Aladin with the provided photometry for the image easily overlaid on top.
Testimonials
We’ve been using the OSS Pipeline with our students so they can spend more time learning and less just doing repetitive image processing tasks like calibration. It’s worked beautifully. They’ve gained time and enthusiasm for research. Now we’re going to use it for new research observatory.
We think we could be getting 8 hours of data several nights a week! That’s looked like real challenge to us to process – more than we can handle really. With OSS we can bypass most of that. We’ll not only collect 8 hours of data a night but then process it within a reasonable time while we do our other work and live our lives. We’ll be able observe a variable over the course of the week and then simply wait a day or so for the pipeline to do its magic– and then, BAM, our light curve comes back ready to analyze, submit and even publish.
- Pat Boyce, Executive Director, Boyce Research Initiatives and Education Foundation (BRIEF)
Using the OSS Pipeline has enabled my students to engage much more deeply with the science of their images than would have been possible otherwise. The fact that OSS makes several types of photometry available inspired them to learn about PSF, and to understand some of the considerations that go into selecting an appropriate method of counting photons for a particular set of images. In the process, they developed Python code that makes use of the astropy modules employed by professional astronomers in their investigations of stars. Through the OSS Pipeline and the generous help and support of Michael Fitzgerald, we have become empowered to dip our toes into real astronomical research, which has delivered immeasurable benefit to my students (and their instructor!).
- Kalee Tock, Stanford Online High School
Background
The OSS-Pipeline grew organically out of a need to streamline image processing and analysis for teachers in the classroom and student researchers involved in the Our Solar Siblings project. As one of the goals of OSS is to provide capacity for student researchers to publish their results in the astronomical literature, this streamlining is done with great attention to scientific rigour and validity. The one key issue for these users, amongst many others, is to minimise the cost in hours of human time to achieve what they required from the astronomical data. On the project side, the key issue was also to minimise the cost in hours of human time to organise and distribute the images and data products to users. A longer explanation of the rationale and the basics of the pipeline can be found in a preprint of an article accepted to the RTSRE Conference Proceedings available here.
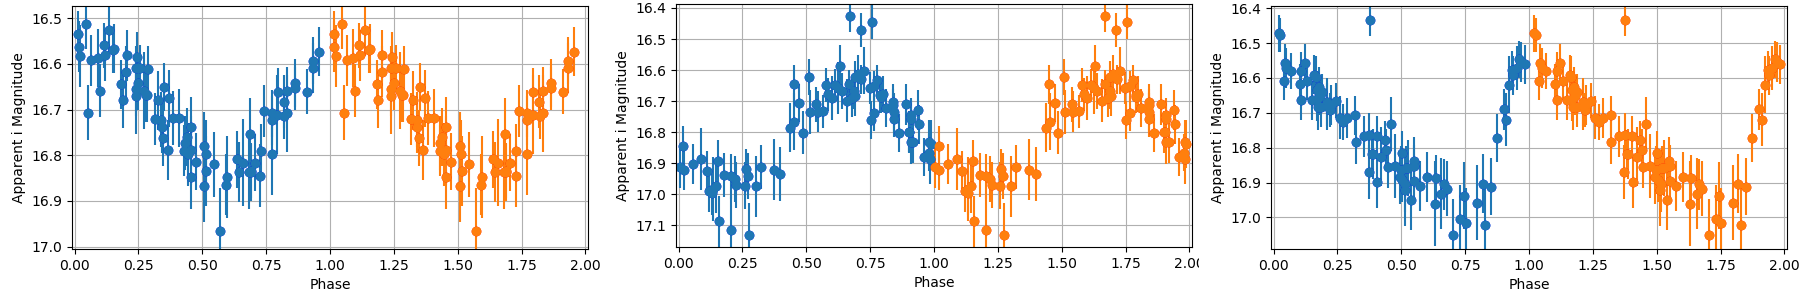
Above: Three calibrated lightcurves automatically extracted from the OSS-pipeline of RR Lyrae in the central region of a globular cluster.
The pipeline works to create final images and related data products upon which science can be immediately performed without a lengthy manual (and hence error-prone) reduction procedure on the part of the user. It has processed data from numerous observatories such as Pan-STARRS, SDSS, Kitt Peak, the 2.3m ATT at Siding Spring Observatory, a variety of LCO, iTelescope and Sierra Remote Observatories telescopes as well as images from numerous backyard observers. In doing so, it has been designed to ‘fix’ fits header and image issues so that images work on all* modern astronomy software and contains . (The ‘*’ refers to the fact that, still to this day, some major pro-am astronomy packages still only deal with 16-bit integer fits files, whereas the current astronomy standard is 32-bit float fits files which is what the pipeline provides. Images out of the pipeline can be downsampled to 16-bit integer upon request.).
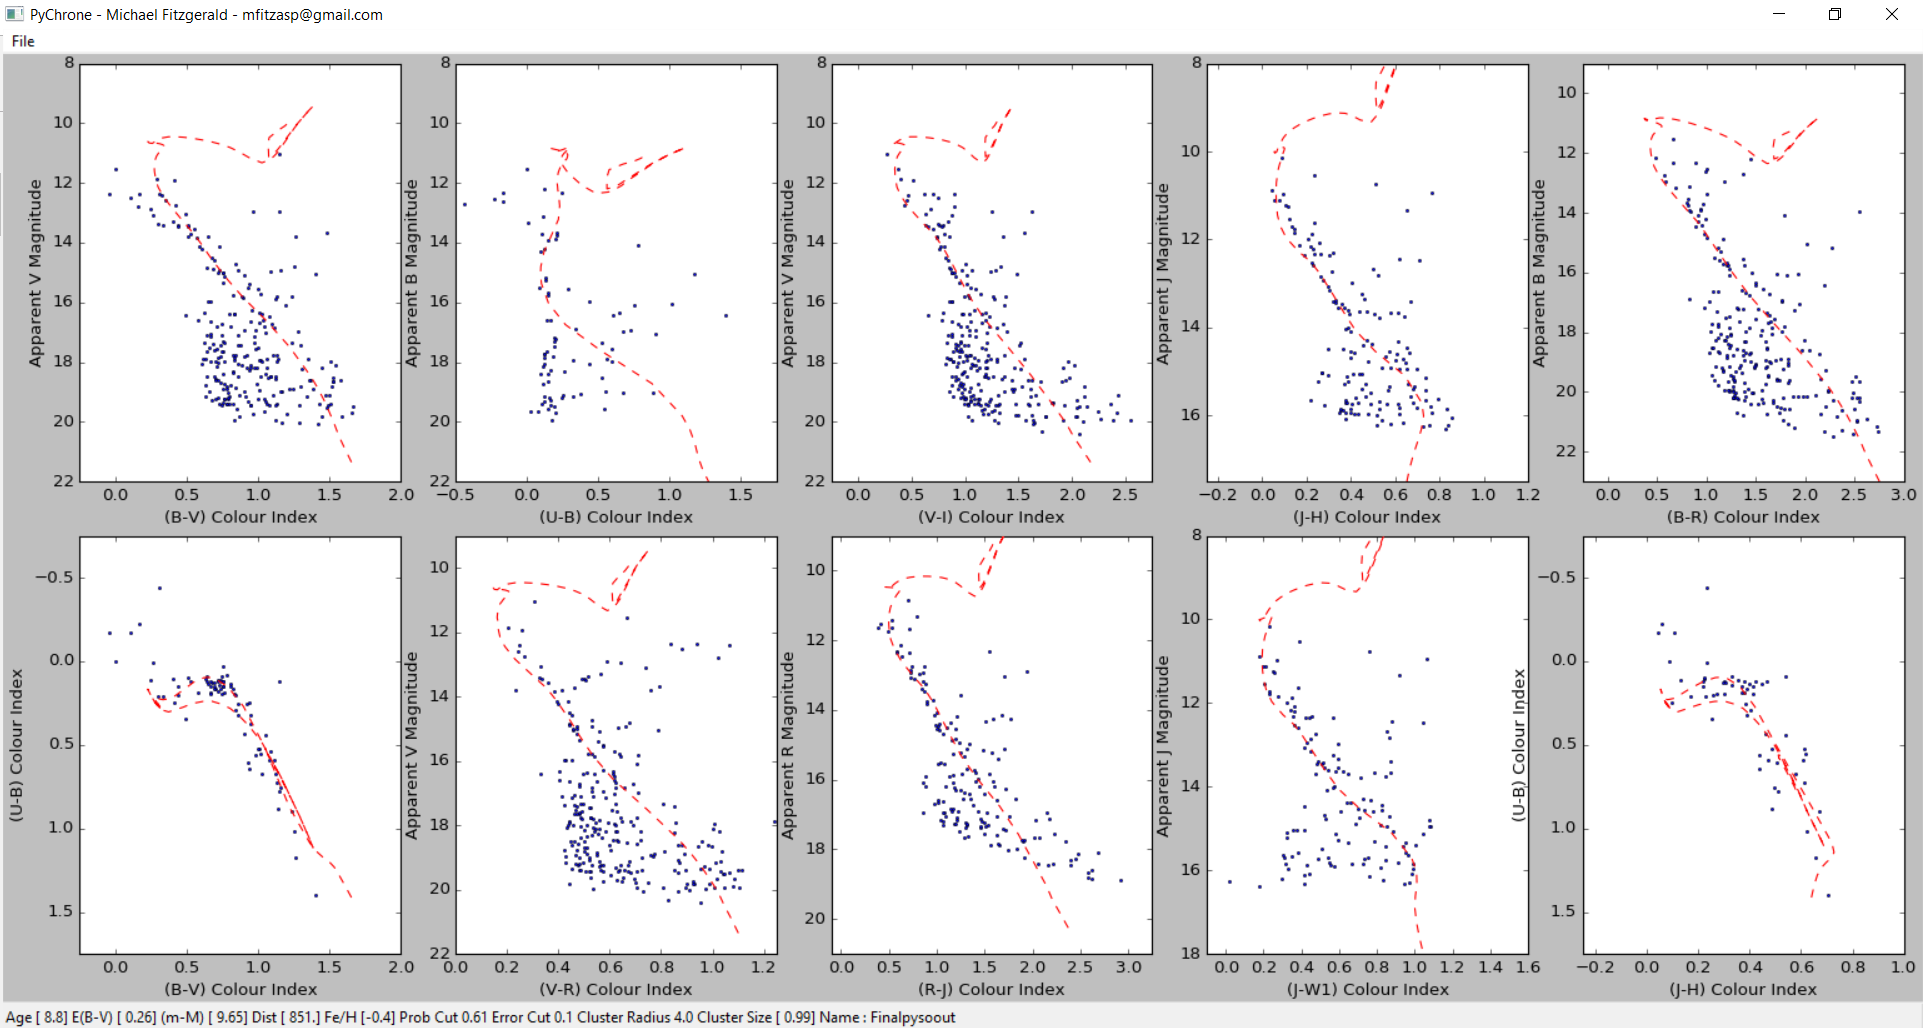
Above: An example of calibrated and cross-matched data from the pipeline open in PysoChrone, also from OSS. This study was published in The Astronomical Journal
The pipeline is a subscription model, rather than a local install-able package, for a few reasons. The software used in the pipeline, while driven by python largely at a fundamental level, is an amalgam of mostly custom software in python that also drives a number of professional astonomy packages based in Linux written in different programming languages, including C, Java and FORTRAN. There are many instances in the pipeline where the standard install of such software needs to be tweaked (and in some cases, fixed) and most of the numerous default options are not optimally set. Hence, it would be a daunting task to create an instruction manual to install, fix and set all of this software. Having this software and options set at a central location allows not only for simpler maintenance and bugfixing (rather than sending out patches) but also allows for homogenous photometry and image quality across multiple users. It also allows authors of scientific papers to reference the OSS-Pipeline and astrosource as the reduction tool rather than need to explain in detail their own unique idiosyncratic reduction procedure.
If you would like to see what the pipeline can do, please upload a set of images (<50 images) from a single observatory run as a zip to this dropbox folder linked here and send michael@oursolarsiblings.com a quick email to notify us that they are there.
Custom solutions/setups/distributions, both large and minor are always available and, in fact, welcomed, please email michael@oursolarsiblings.com to discuss! We are very happy to customise the output to what you need and help provide it in an easily distributable form. One-off and trial services will utilise this dropbox approach to transfer data. For subscription services, we will sort out the best way to automatically collect and process the data (although the manual approach would also be available).
Services Provided
Obviously a “night” is a fuzzy concept given the Earth’s tilt and it’s orbit around the sun. If you only ever observe the first half of a night, then that is half a night. There won’t be any great accounting done, the cheaper rates are primarily to cater to those users whose observatory is not usable every night…. for the various reasons we all know about! As we start to scale up our provisions, we are offering relatively cost-effective service to automate most of your post-processing and analysis for you. You will require a Dropbox account as we will use this as the basis of file transfer from your observatory to our computers and back to you after processing. Other distribution options are possible, but dropbox seems to be the most robust.